Ramps
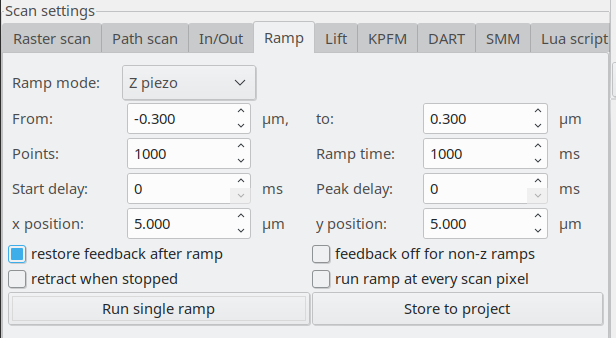
The “Ramp” tab in “Scan settings” area allows to perform ramps - to measure dependence of some quantity on some other quantity, e.g. a force-distance curve or I/V spectrum.
When use switches to this tab, the normal free-running operation of the graphs in the right panel of the GUI is stopped, and the graphs are ready to show the measured ramps. The settings can be controlled as shown here:
Clicking to “Store to project” adds the last measured ramp to the project, to be later saved as a Gwyddion file.
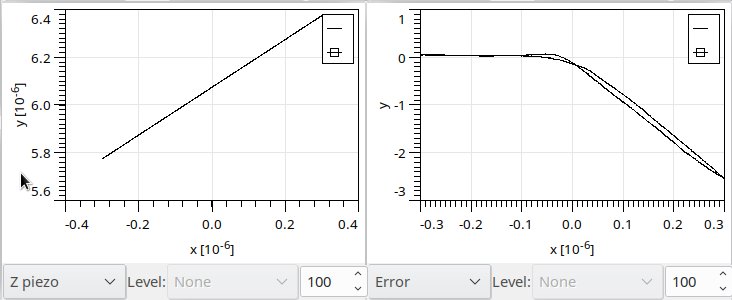
As an example, when operated in contact mode, the above settings provide the following result when clicked on “Run single ramp”. It shows a force-distance curve. The error signal (measure of force) is upside down (when compared to how it is plotted typically) as in our case the probe-sample detection electronics provides lower signal for higher forces.