
Lua scripting based adaptive scanning
Lua scripting interface can be used for performing regular scans, as described in the Lua API documentation, however it can be also very efficient when creating custom scripts for self-controlled adaptive measurements.
For this, statistical functions for Lua that can make the scripts smarter are being continuously added and documented in detail here:
gws_get_period: determines the period of a periodic structure in the data, using a scanned set of data (e.g. a single line). For the analysis function uses the FFT based method described the paper Demystifying the analysis of periodic structures by David Nečas.
gws_get_correlation_length: determines the surface roughness correlation length, using a scanned set of data (e.g. a single line). This can be used to optimize the sampling when roughness should be evaluated from the measured data. The methodology used for the analysis is based on the paper How levelling and scan line corrections ruin roughness measurement and how to prevent it by David Nečas.
gws_get_optimum_angle: uses the gws_get_period function and a set of profiles measured at different angles to get an optimum angle for periodic structure measurements.
gws_fit_parabola: performs fitting of 1D data set using parabolic function, to be used in any optimisation task.
Other functions to be added soon.
Examples
1D diffraction grating measurement at determined optimum angle. The sample is roughly placed into microscope, being approximately orthogonal to the microscope scanner axes. Five profiles are taken at different angles and optimum angle corresponding to the minimum period is chosen for the next scan. A benefit of the rest of the acquired data is that the fast scanning axis is now perpendicular to the grating grooves which makes the evaluation much easier.
local scan = {}

function scan_line_at_angle(p, xcentre, ycentre, range, angle, res)
    xstart = xcentre + range/2 - range/2*math.cos(angle)
    ystart = ycentre - range/2*math.sin(angle)
    xend = xcentre + range/2 + range/2*math.cos(angle)
    yend = ycentre + range/2*math.sin(angle)
    gws_move_to(p, xstart, ystart, 0)
    return gws_scan_and_store(p, xend, yend, res, 0)
end

function scan_line_at_angle_offset(p, xcentre, ycentre, range, angle, res)
    xstart = xcentre + range/2 - range/2*math.cos(angle) - ycentre*math.sin(angle)
    ystart = ycentre - range/2*math.sin(angle)
    xend = xcentre + range/2 + range/2*math.cos(angle) - ycentre*math.sin(angle)
    yend = ycentre + range/2*math.sin(angle)
    gws_move_to(p, xstart, ystart, 0)
    return gws_scan_and_store(p, xend, yend, res, 0)
end

function scan.runit()
    print "scanning"
    gws_clear(p)
    range = 20e-6
    xoff = 1.5e-6
    yoff = 1.5e-6
    y = yoff + range/2
    res = 500
    dx = range/res
    for angle = -0.1, 0.1, 0.05 do
       n = scan_line_at_angle(p, xoff, yoff + y, range, angle, res)
       period = gws_get_period(p, n-res, n)
       print(angle, period)
    end
    angle = gws_get_optimum_angle(p, n-5*res, n-4*res, -0.1,
                                     n-4*res, n-3*res, -0.05,
                                     n-3*res, n-2*res, 0,
                                     n-2*res, n-res, 0.05,
                                     n-res, n, 0.1)

   -- scan with the found angle
   for y = 0, range, dx do
       scan_line_at_angle_offset(p, xoff, yoff + y, range, angle, res)
   end

end
return scan
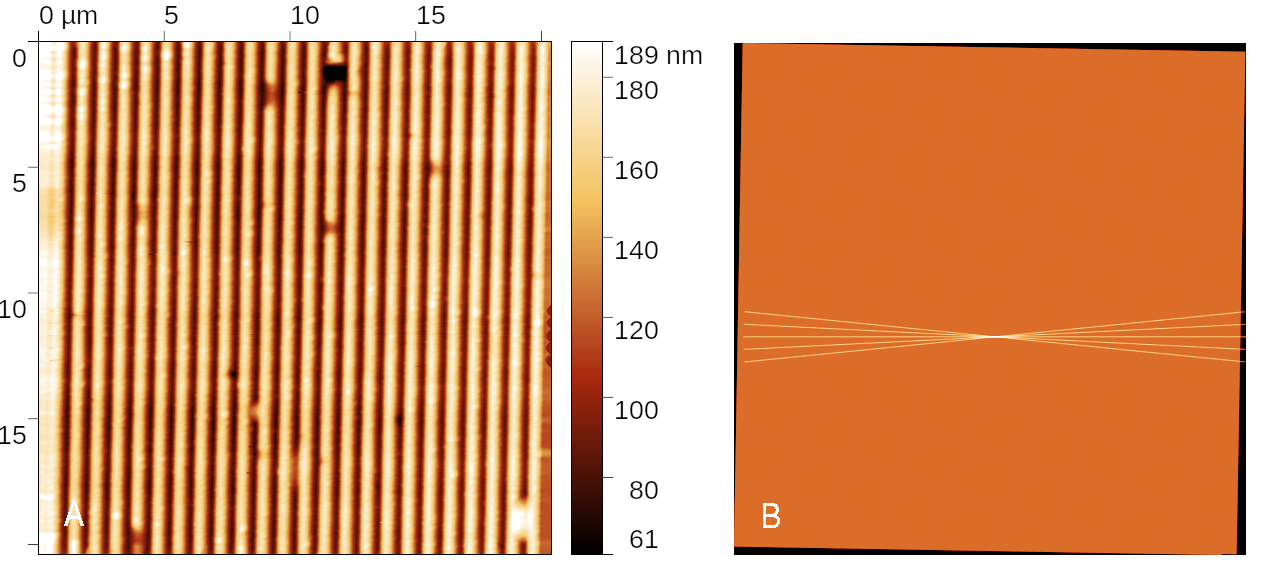
Diffraction grating measurement taken along the optimum direction (left) and data density showing the measurement progress, including the initial set of profiles to determine the angle (right).
Surface roughness measurement with optimal collection of statistical information, based on local correlation length. When only roughness statistical parameters should be analysed from the SPM measurement, it is not very efficient to collect profiles that are too close - they are correlated. Using slow axis sampling proportional to the local correlation length speeds up the scan by an order of magnitude, compared to a regular scan, preserving the amount of statistical information the same.
local scan = {}

function scan.runit()
    print "scanning"
    gws_clear(p)
    yoffset = 6e-6
    y = yoffset
    dx = 0.006e-6
    Tavg = -1
    repeat
       xstart = 0
       ystart = y
       xend = 6e-6
       yend = y;
       gws_move_to(p, xstart, ystart, 0)
       n = gws_scan_and_store(p, xend, yend, 1000, 0)

       Tpix = gws_get_correlation_length(p, n-1000, n)
       if Tavg <= 0.0 then
           Tavg = Tpix
       else
           Tavg = 0.75*Tavg + 0.25*Tpix
       end
       -- Move about one correlation length down
       print(Tpix*dx, Tavg*dx)
       y = y + Tavg*dx
    until (y >= (6e-6 + yoffset))
end
return scan
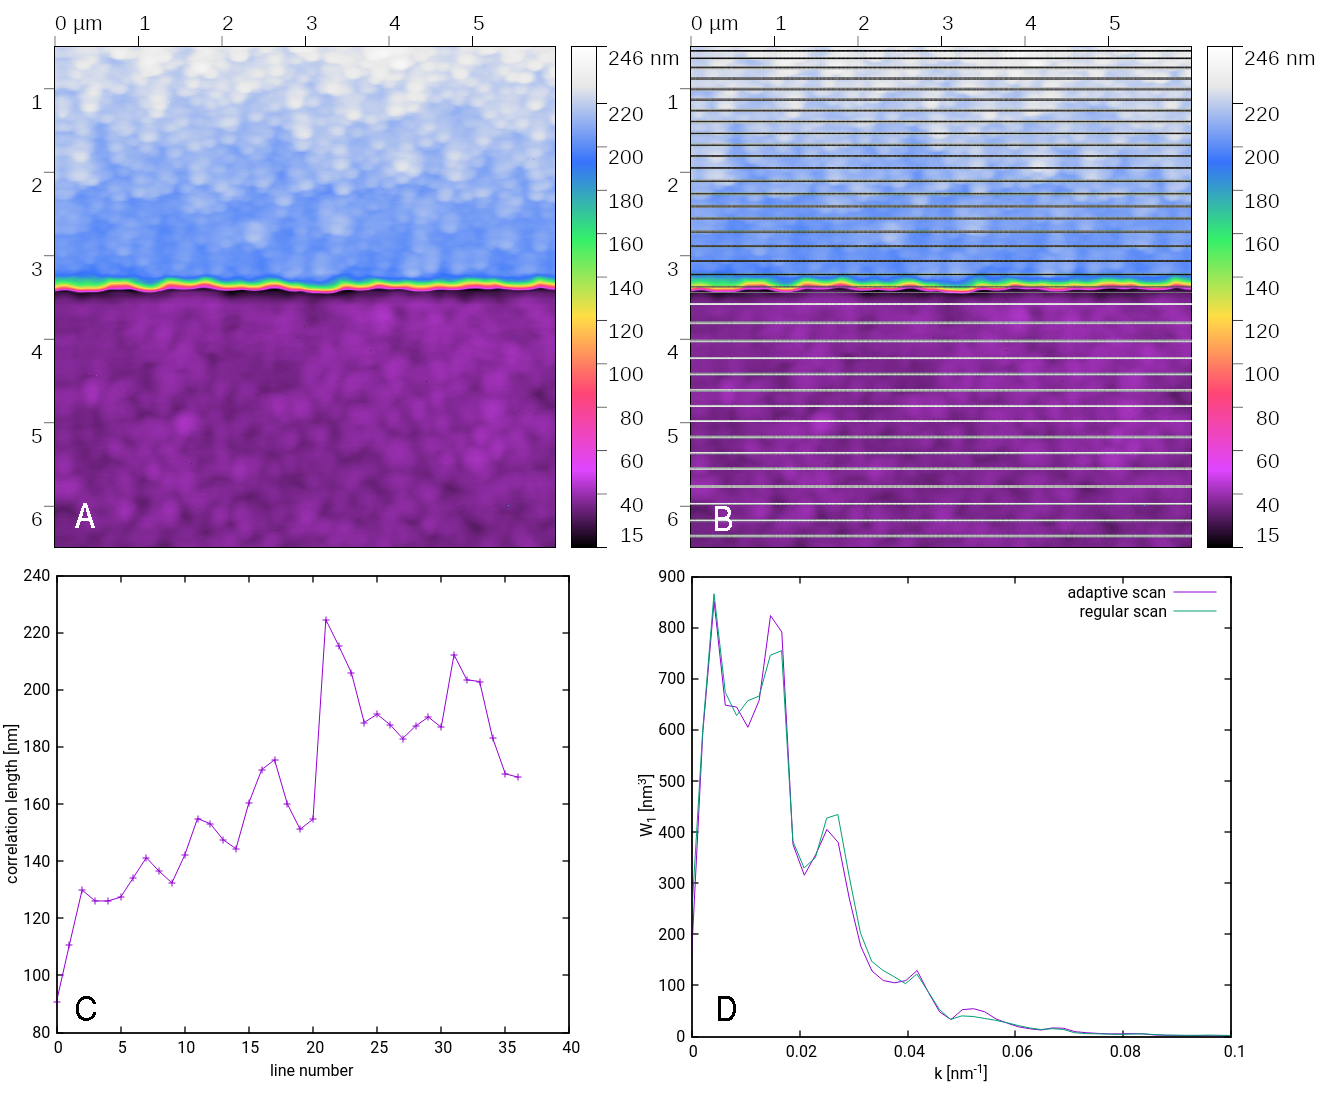
Sample with two different roughnesses: A) regular scan, B) illustration where the adaptive scan decided to take profiles, C) estimated correlation lengths, D) comparison of the power spectral density at upper half of the sample obtained from regular and from adaptive scan.